
Splunk Transaction: Have you noticed the exceptional growth of big data in the current day market? Starting as a mere buzz, big data has reached the value of $27 billion in 2021 all thanks to the growing numbers of machines in IT structure and IoT devices. Machine data indeed holds the power to transform the way businesses run across the world bringing more visibility and efficiency into the production processes.
Splunk Transaction Command allows Splunk users to locate events that match certain criteria. Transactions usually include information such as the duration between events and the number of events.
Splunk, which was invented back in 2003 to make sense of machine-generated data has not become a data-to-everything platform for modern-day businesses. As businesses started to realize the significance of machine data, the demand started to touch the sky. However, the constant demand and supply of Spunk professionals attracted young talent willing to build a future in this technology. If you are one of those and want to start with basics, then here is the post for you.
What is transaction command?
Transaction command allows Splunk users to locate events that match certain criteria.
What is Splunk?
If put in the simplest manner possible, Splunk is like the Google Search Engine for machine data. Sounds strange right? But this is how Erik Swan the ETO and co-founder of Splunk has described it. Now, explaining in layman’s language- Splunk can make machine data better, easier, and less complicated to understand. Let’s take an example to understand what Splunk does with the help of the following image:

Now imagine you are trying to figure out the problem in your system and the only lead you have is the logs that are similar to the above image, what would you do? As running away is not an option here, you might try to figure out the above data. But is it that easy to figure out the problem from the above data? There is a small possibility that you might figure out the problem only after spending hours understanding the data. In short, machine data is:
- Complex to comprehend
- Comes in an unstructured format
- Not suitable for analyzation
Here comes Splunk to rescue by simplifying the machine data. All you need to do is feed the machine data to Splunk and it will automatically process and extract the valuable data from the system.
Splunk transaction command examples
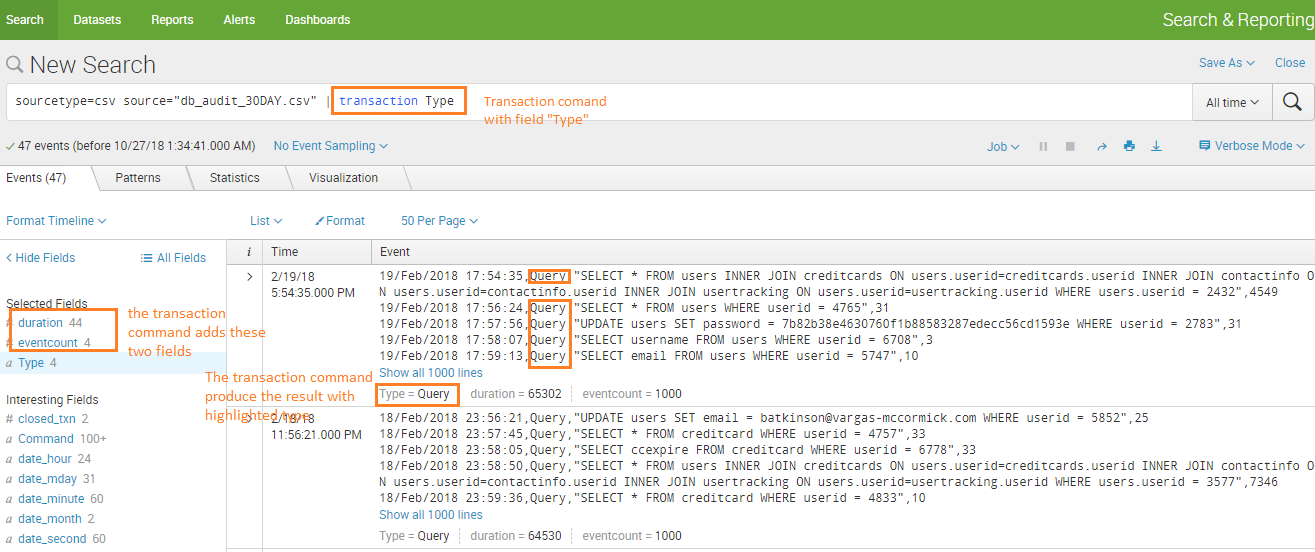
Example 1: Transactions with the same Type
Example 2: Transaction command with maxevent

Example 3: Calculate duration based on “startwith” and “endwith” of event.

Splunk Transaction Example 4
An example of a Splunk transaction might be someone making a purchase in an online store. Another example could be a known issue where out-of-memory events are correlated to database errors.
Transactions can be created using the transaction command. It basically aggregates events together.
Here is an example I took directly out of the official Splunk documentation:
sourcetype=access_logs* | transaction JSESSIONID clientip startswith="view" endswith="purchase" | where duration>0
Essentially, the transaction will be composed of all records with both the same session ID ( JSESSIONID ) and the same client IP (clientip) that fall beween a start and end value. The transaction will start with a record that includes the word “view” and end with a record that includes the word “purchase”. The duration field is added by the transaction command. We pipe to this so that we can make sure that the transaction isn’t too short and therefore invalid. Note that we aren’t doing any filtering in this example so it could take longer than it needs to to process.
Splunk Transaction Example 4
sourcetype=access_logs* | transaction JSESSIONID clientip startswith="view" endswith="purchase" | where duration>0

<meta charset='utf-8'>sourcetype="cisco:firewall" index=firewall (event_id="tunnel-up" OR event_id="tunnel-down")
| transaction device_name startswith=tunnel-down endswith=tunnel-up

sourcetype="cisco:firewall" index=firewall (event_id="tunnel-up" OR event_id="tunnel-down")
| transaction device_name startswith=tunnel-up endswith=tunnel-down
Splunk Transaction vs Stats Command
Both of these are used to aggregate events. The stats command just takes statistics and discards the actual events. The Splunk transaction command doesn’t really compute any statistics but it does save all of the records in the transaction. It also has more complex options.
transactiontypes.conf
What are the different elements of Splunk?
Splunk as a software platform processes the machine data in real-time and it has several elements to further filter the data to meet the demand.
Splunk sub search
Sub search is a search in Splunk that is used to narrow down the sets of events one searches on. The result of the sub search is then used as a primary source for further search. In Splunk, Sub searches are enclosed in the square brackets with the primary search and are evaluated on priority.
Splunk search index
When it comes to simplifying the pile of data, Splunk users rely upon the “Search Index” – another key element of Splunk that is used for speeding up the search process by providing the numeric addresses to the piece of data. Here, the context of Splunk indexing is similar to the context of indexing in the database. The installation of Splunk primary creates three different search indexes:
- Main- Where all the processed data is stored.
- Internal- It stores internal logs and processed metrics.
- Audit- As the term suggests, this index stores events related to the file system, user history and audit.
Data that is processed in Splunk is then, created and maintained into these indexes either by default or the way you have designed it.
Splunk Commands
There are several commands in Splunk that make this search processing language easy to use. While it is complicated to mention all of them, here are some of the key commands that you can use in Splunk:
- Abstract: Produces the summary of the result.
- Addcoltotals: Computes the events that have all the numeric fields of previous events.
- Anomalies: Gather the “unexpected” score for the event.
- Append: Compute subsearch results to current results.
- Audit: Contains audit trail information that is stored in audit.
- Bucketdir: Replaces the field value with high value.
- Cluster: Clusters similar events.
- Correlate: Calculate and present the correlation between different fields.
- Delta: Used to compute the field difference in nearby results.
- Erex: Enables you to specify example values to extract fields with similar values.
- Filldown: Replace the NULL value with a non-null value.
As these are just a few examples of Splunk Commands, you can encounter more while working on the language.
Splunk Query
Splunk Query is another common term, you should cover in the basics. Splunk Query is used to running a specific operation within the Splunk Software. Unlike other elements, Splunk Query utilizes the software’s data processing language to communicate with the database or source of data. In many organizations, Splunk Query is used for parsing long files and extracting reference information from machine-produced data. It is ideal for those who have a number of sources that require processing and analysis simultaneously to generate real-time results.
Splunk Match
No one likes the mismatched especially when you are relying on them to make important business-related decisions. Data that is hard to filter and can’t be paired up with patterned data becomes more of an obstacle than an asset. Therefore, a Regular Expression (regex) is there to search through the text to find a pattern that matches your data. It is an amazing filtration tool that allows you to perform advanced pattern matching without any hassle.
Splunk Eventcount
This is again the report generating command in Splunk that is used to get the count of events in a specified index without any timestamp information.
Splunk ids
In the world of data, where unwanted snoopers are just one wrong click away, Splunk users need some advanced security system to prevent data breaches. Intrusion detection (IDS) are and preventive data (IPS) are two parallel security systems that are used to prevent valuable data in Splunk software. While IDS work by exposing the network and server attacks, IPS provides advanced security defence to protect the network and server from malicious hackers.
Splunk Search Examples
Here are the examples of search commands in Splunk.

Transaction Use Cases
This is a solid foundation for most use cases, let’s break it down:
- <field>
- Maxevents
- Startswith
- Endswith
A Splunk transaction is a series of events that are related and should be treated as a single unit. For example, a web request transaction might consist of an HTTP request event, an HTTP response event, and possibly other related events such as log messages or error messages.
Here is an example of a Splunk transaction:
- A user initiates a web request by entering a URL into their web browser.
- The web server receives the request and generates an HTTP request event.
- The web server processes the request and generates an HTTP response event.
- The web server logs any relevant information, such as the user’s IP address, the request method, and the response status code.
- The user’s web browser receives the HTTP response and displays the requested webpage.
In this example, the HTTP request event, the HTTP response event, and the log messages are all part of the same web request transaction. Splunk can be used to track and analyze these transactions to gain insights into web server performance and user behavior.
To define a transaction in Splunk, you can use the transaction command in a search query. For example, the following search query defines a transaction based on the request_id field:
transaction request_id
This will group all events with the same request_id into a single transaction. You can then use additional Splunk commands and functions to analyze the transactions and extract insights.
When Using The Time Chart Command Which Axis Represents Time In Splunk
Concerning Splunk, the time chart command is utilized in generating a chart that shows the supply of data over time. Moreover, the chart generated by the time chart command is a bar chart that shows the occurrence of events for every time interval. To efficiently use the timechart command, it’s significant to understand the time axis plus the way it represents time in Splunk. Let’s find out the time axis in Splunk plus its representation when utilizing the time chart command.
Understanding Time Axis in Splunk
In Splunk, the time axis is the x-axis in the chart which represents time. The time axis shows the time intervals in which the data is aggregated. In Splunk, the time axis is auto-generated depending on the time range chosen for the chart.
Specifying Time Interval for Time Axis
When utilizing the timechart command, one can specify a time interval for the time axis utilizing the bin command. This enables one to specify the length of time intervals in minutes, seconds, hours, or days. For instance, if you need to generate a chart with time intervals of five minutes, you will utilize the syntax below:
timechart span=5m count
Time Ranges for Time Axis
Apart from specifying the time interval, one could also state the time range for the chart utilizing the time command. Time command enables one to specify the start & end time for a chart. For instance, if you need to generate a chart within 24 hours, one would utilize the syntax below.
timechart span=5m count over 24h
Showing the Time Axis in a Customized Format
The time axis in Splunk is auto-shown in a standard format. That is YYYY-MM-DD HH:MM:SS. Moreover, you can modify the format of the time axis with the help of the timeformat command. The Timeformat command enables one to state the format for the time axis utilizing strftime codes. For instance, if you need to show the time axis in a MM/DD/YYYY format, you would need to use the syntax below.
timechart span=5m count over 24h timeformat="%m/%d/%Y"
Understanding Time Granularity of Time Axis
The time granularity of the time axis is determined by the least unit of time explained in the time format command. For instance, if the time format is stated as “%Y-%m-%d”, time granularity is at the day level. If the time format is defined as “%Y-%m-%d %H:%M”, the time granularity will be at a minute level. The time granularity shows the smallest unit of time which can be displayed on a time axis.
Conclusion
The time axis in Splunk shows time & displays time intervals for which the information is being aggregated. When utilizing the time chart command, one could specify the time interval plus time range for the time axis, and also show the time axis in a customized format. Getting to know the time axis plus its representation when utilizing the time chart command is significant to efficiently generate charts that show the distribution of data over time.
Splunk Interview Questions
Now, after covering the above information you may feel confident to crack the Splunk interview but wait there is much more to learn and showcase during the interview. Here is what you should know before walking into the interview room.
1. What is Splunk?
Although it is one of the most obvious questions that you witness on every corner, you must answer it with confidence. You can start your answer by defining Splunk stating “It is a big data tool that gathers the machine-generated data and works as a search engine to search, visualize, report, and monitor the data. As an advanced tool, Splunk turns scattered data into valuable and powerful operational intelligence by providing readable information, real-time insights, alerts, charts, reports, etc.” This Splunk Interview answer will surely win the Interviewer.
2. Can you list out the number of command categories in Splunk?
The commands help in various tasks ranging from searching, filtering, arranging, and generating data reports. As a professional you should know that there are 6 main categories of commands in Splunk:
- Distributed streaming command
- Transforming command
- Centralized command
- Generating command
- Database processing command
- Orchestrating command
3. What is the role of the eval command?
Eval command in Splunk is used for calculating an expression, which is similar to a mathematical expression. In Splunk, you can add multiple expressions in a single search with a comma.
4. Define replace command?
You can use this command to replace specific field values with required values.
5. Describe the usage of the stat command?
The stat command is used to calculate the statistical aggregation of the dataset including sum, average, and count.
6. What is a table command?
In Splunk, you can use this command to go back to the tabular view of the results.
7. What does the xyseries command do?
xyseries command is used to convert the search result into the format that can be used for easy graphical presentation. For example; – Pie charts, columns, line charts, and more.
8. Describe the role of spath command?
As a professional, you should know that If you want to extract fields from structured data formats such as XML, JSON, etc.
9. How will you use the sort command to get ascending and descending order search?
You have to fill the following commands to get ascending and descending order search:
- Ascending order: sort + / sort displays search
- Descending order: sort – sort displays search
10. What is the join command?
As you can already figure out from the term “join” itself, this command in Splunk is used to combine the result of two search results. However, the field must be common to join the end results.
11. Differentiate between stats and timechart command?
There are different factors that actually sets time charts apart from stats. In your Splunk interview question, you can describe these commands on two main factors:
Aggregate
- Stats is used to aggregate the statistical calculation through functions such as sum, count, average, etc.
- Timechart is used to give the search result a form of the graphical presentation that viewers can easily understand.
Number of fields
- Stats can be used with more than one field for the grouping purpose.
- Time charts can only be used with one field.
12. What is a regex command?
The regex command in Splunk is used to provide the results that match the desired regular expression.
13. Explain the use of the top command in Splunk?
The top command is used to display the count and percentage of occurrence of a value of a certain field in the result set.
14. Describe the difference between stats and eventstats commands?
Stats command in Splunk is used for the summary statistics of the existing fields available in the search and later stored in the new fields. On the other hand, eventstats command is used to add the aggregation results of every event only if aggregation applies to that certain event.
15. When do you need a lookup command?
In Splunk, the lookup command is used to compare your event data with the external file. By using the command, you can further narrow down the results that match fields in event data.
16. Stats vs. Transaction commands: How do you differentiate them?
The transaction command is used in a condition where the unique ID is not enough to differentiate between two transactions. For example; in the mail server’s log, you can find both sender id and recipient id for different events with the same MID. As it will be challenging to differentiate between two transactions, you will use the transaction command to gather all events with the same MID.
In other cases, professionals prefer to use stats as it delivers better performance, and can be easily used in the distributed search environment.
17. What is the role of Splunk Alert?
There are some situations, when you may want to monitor and respond to a certain event. In that particular situation, you can use Splunk alert. Let’s take an example to understand it in a better way. You send a notification to the user every time there are more than 5 failed attempts to log in to ensure no one else is breaking into the account.
18. How do you extract fields?
There are basically two different ways to extract fields in Splunk known as:
- Interactive Field Extractor
- Regular Expression
19. What do you know about Pivot and data models?
In Splunk, Pivot is used to create the front views of the output and then, you can choose the relevant filter for a better view. These are the ideal options for those who come from a non-technical background.
On the other hand, data models are used to create hierarchical models of data. However, it can also be used when you have a large pile of unstructured data in hand. Through this command, you can make use of the information without any complex search queries.
20. What do you understand about the default field?
There are 5 default fields that you can spot in Splunk. These include:
- Host
- Source
- Source type
- Index
- Timestamp
We hope you can successfully crack the Splunk interview with all the basic information and interview questions. However, if you want to stay updated regarding other technical topics, then feel free to visit HTML Kick today.
FAQs Splunk Transaction Command
How does Splunk Transaction differ from traditional analytics tools?
Splunk Transaction stands out by offering real-time transaction monitoring, providing a comprehensive view that traditional tools may lack. Its ability to process vast data sets sets it apart in the analytics landscape.
Can Splunk Transaction handle diverse data sources?
Yes, Sure
Is Splunk Transaction suitable for small businesses?
Yes, it is suitable for small businesses
What security features does Splunk Transaction offer?
1- Transaction correlation
2- Transaction anomaly detection
3- Transaction tracing
Can Splunk Transaction be integrated with other analytics tools?
Yes. Splunk Transaction is designed to complement existing analytics tools
What industries can benefit most from Splunk Transaction?
Splunk Transaction finds applications across various industries, including IT, finance, healthcare, and more.