
How to index in Splunk
Indexing refers to the process of organizing information in Splunk for it to be searched & analyzed efficiently. Let’s have a look at how you can index data in Splunk & some of the best practices for indexing data.

What is an Index in Splunk?
In Splunk, an index refers to a repository for keeping & organizing data. When information is added to Splunk, it’s indexed & stored in a manner that enables fast searching plus retrieval. Every index comes with a set of properties that determines the way data is processed and stored, like the source type, replication factor, and retention period.
How to Index Data in Splunk?
There are two major methods by which you can index data in Splunk. The first one is through the Splunk Web interface and the second one is through configuration files.
Indexing Data via the Splunk Web Interface
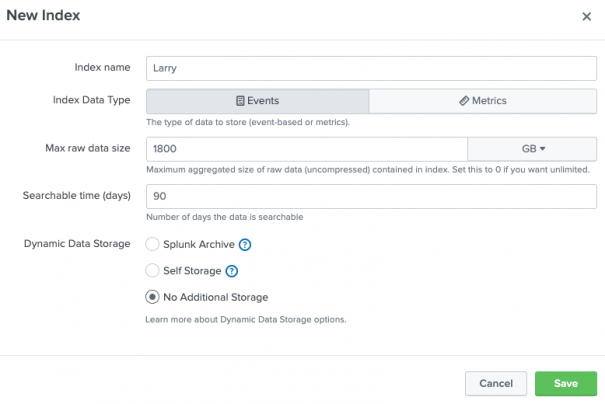
To index data via the Splunk Web interface, you need to follow the steps highlighted below:
- Log in to the Splunk Web interface as an admin.
- Move to the Settings menu and click on Data inputs.
- Choose Files & Directories.
- Select New.
- At Add Data window, key in a name for data input, choose the kind of data input (like the file or directory), and key in the path to the information.
- In the Index field, choose the index that you need to index the information into.
- Click on Next.
- Configure any more settings, like the source type or host as required.
- Click on Review, then click on Submit to begin the indexing process.
Indexing Data via Configuration Files
To index data using configuration files, you will require to improve the inputs.conf file in the etc/system/local directory. Follow the steps highlighted below:
- Log in to the Splunk server as an admin.
- Open etc/system/local/inputs.conf file in a text editor.
- Key in the lines below to the inputs.conf file, substituting the values using your data:
[<data_input_type>]index = <index_name>path = <path_to_data>- Save the changes made to the inputs.conf file.
- Restart Splunk to save the changes.
Best Practices for Indexing Data
- Plan your indexing strategy
It’s significant to plan your indexing strategy before anything else. Determine which information is most important, how you need to organize your information and the way you need to manage your disk space usage.
- Utilize a separate index for various kinds of data
Use a different index for various kinds of data, such as events, logs, & metrics, to make it simpler to search plus analyze data.
- Use source types to classify data
Utilize the source types to categorize information into certain categories like log files, system events, or network traffic to make it simpler to search & analyze the data.
- Check disk space usage
Check the disk space usage frequently and change your indexing strategy as required to ensure that you’ve sufficient disk space for your information.
- Use index replication for higher availability
Utilize index replication to confirm that your information is available even if a node fails. This will help to guarantee that your information is always available for analysis and searching.
Conclusion
Indexing information in Splunk is a significant task for gaining insights into your data & making an informed decision. By adding data to Splunk utilizing one of the available ways and following best practices for indexing information, always ensure that your information is stored & analyzed efficiently in Splunk.
- How To Get Splunk Power User Certification?
- What command finds the most common values of a given field in Splunk
- Is Splunk A Valid Scrabble Word?
How to remove others in the Splunk chart?
When utilizing the Splunk charting features, you can encounter an “Other” category that appears in your charts. This category signifies data points that aren’t included in the top N categories, and it can be distracting and confusing to users who’re analyzing the information. Fortunately, one could easily eliminate the “Other” category in Splunk charts with the help of charting commands and choices available in Splunk. In this article, we will explain how one can remove the “Other” category from Splunk charts.

What is the “Other” Category in Splunk?
In Splunk, the “Other” category is a catch-all category that’s created when a chart has several data points. This category shows the sum of every data point which falls below a certain threshold, normally defined as a percentage of the total information. The function of the “Other” category is to simplify the chart & make it more readable by grouping small data points.
Why Eliminate the “Other” Category?
The “Other” category can be of importance for simplifying complex charts and it can also make it hard to interpret the information accurately. By grouping small data points, the “Other” category could hide significant details & distort the general picture of the data. For instance, if you’re trying to find patterns or trends in your data, the “Other” category can prevent you from viewing smaller data points which are crucial to understanding the data.
Steps Involved in Removing the “Other” Category from a Chart in Splunk
You can remove the “Other” category from a chart in Splunk through two methods. That includes either using a search command or changing the chart’s configuration.
Changing the Chart Configuration
Step 1: Go to Chart Configuration Panel
To eliminate the “Other” category from a chart in Splunk, you need to open the chart configuration panel by clicking on the “Edit” button located in the chart’s toolbar.
Step 2: Move to the Formatting Options
At the chart configuration panel, select the “Formatting” tab.
Step 3: Change the “Other” Threshold
In the “Data Labels” section, you’ll view a “Threshold” option. This option is set to 5% automatically, which means that every data point which is less than 5% of its total will be grouped into the “Other” category. To eliminate the “Other” category, set the threshold to zero or raise it to a higher percentage.
Step 4: Save the Changes
Once you’ve changed the threshold, chose “Apply” to save the changes made. The chart will now show minus the “Other” category.
Method 2: Using a Search Command
Step 1: Go to the Search Bar
To eliminate the “Other” category from a chart utilizing a search command, you need to open the search bar in Splunk first.
Step 2: Utilize the “top” Command
In the search bar, utilize the “top” command to form a table of the data points that one needs to show in your chart. For instance, if you need to create a chart that shows the top 10 values of a field known as “myfield,” you will utilize the following search command:
mysearch | top 10 myfieldStep 3: Utilize the “addtotals” Command
Next, utilize the “addtotals” command to compute the total of every data point. With this command, you will add a new row to a table that displays the total of every data point.
mysearch | top 10 myfield | addtotalsStep 4 Eliminate the “other” category
To get rid of the “other” category from a chart, you can utilize the where command to filter out every event which belongs to the “other” category. One can do this using adding a where command at the end of the search command which filters out every event where the source is “other”.
For instance, the modified search command may look like this:
index=main | chart count by source limit=5 | where source!="other"This will produce a chart that shows the count of events of the top 5 sources, with no “other” category.
Step 5: Advance the search
Depending on your certain use case, you might require to refine the search further to find the exact chart which you need. For instance, you may need to filter out other sources or limit the time range chart. You can utilize other search commands like search, stats, and eval to further refine your search and create a chart that suits your needs.
Conclusion
Eliminating the “other” category in Splunk charts is useful when you need to concentrate on the most significant data points in your chart. By following the steps highlighted above, you can comfortably eliminate the “other” category from the chart & create a more accurate and focused representation of your information.
- What Is Strptime In Splunk?
- What Is The Splunk Default For The Sessiontimeout Parameter In The Server Conf File?
- What is P90 in Splunk?
How To Get Field Values In Splunk?
When operating with information in Splunk, it is important to understand the process involved in extracting specific field values to analyze and manipulate them. Let’s have a look at the basics of how to get field values in Splunk.

Understanding Fields in Splunk
Fields in Splunk are single pieces of data that make up an event. Moreover, events are the individual data points or logs which are ingested into Splunk. Fields can be auto-extracted by Splunk or can be explained using field extractions or regular expressions.
Fields can be utilized to filter, analyze or sort data. Understanding fields is important to extracting certain values from information in Splunk.
Methods of Getting Field Values in Splunk
There are numerous ways to get field values in Splunk, Among them include:
Field Extraction using Regular Expressions
Regular expressions can be utilized to extract certain field values from data. To extract fields utilizing regular expressions, you can make use of the rex command in your search.
For instance, to extract the IP address field from a log, you can run the search query below:
sourcetype=access_combined | rex "^(?<clientip>[0-9]+\.[0-9]+\.[0-9]+\.[0-9]+)"In this case, the regular expression ^(?<clientip>[0-9]+\.[0-9]+\.[0-9]+\.[0-9]+) is utilized to extract the IP address field.
Automatic Field Extraction
Splunk can auto-extract fields from data and this is understood as automatic field extraction. Splunk utilizes a set of default field extractions, that can be customized depending on the data you’re working with.
To access the auto-extracted fields, you can utilize the Fields sidebar in Search and Reporting app or utilize the fields command in your search.
For instance, to get a list of every field that has been auto-extracted from your information, you can run the search query below:
| tstats count where index=* by _time, sourcetype, host | fields - count, _time, sourcetype, hostField Extraction Using Field Extractions
Field extractions can be utilized to create custom fields that aren’t auto-extracted by Splunk or to extract fields utilizing regular expressions. Field extractions can be created with the help of the Field Transformations Editor, a Field Extractor, or by editing the props.conf & transforms.conf files.
For instance, to extract a custom field known as response_time from a log, one could create a field extraction utilizing the Field Extractor or by adding the lines of code below to your transforms.conf file:
[my_custom_field_extraction]REGEX = response_time=(\d+)FORMAT = response_time::$1After generating the field extraction, one can utilize the eval command available in your search to extract the field value. For instance:
sourcetype=my_custom_sourcetype | eval response_time=coalesce(response_time,0) | stats avg(response_time) as avg_response_timeThe search query above will extract the response_time field & calculate the average response time.
Conclusion
Getting field values in Splunk is important for visualizing and analyzing data. There are numerous methods of extracting field values in Splunk, comprising automatic field extraction, field extractions, and regular expressions. Understanding these methods & how you can them can assist you to work more efficiently with data in Splunk.
Which Argument Can Be Utilized With The Timechart Command To State The Time Range To Utilized When Grouping Events In Splunk?
In Splunk, the timechart command is utilized in creating time series charts that show aggregated data over time. This command groups events depending on a time field & calculates summary statistics like count, sum, minimum/maximum values, and average. To specify the time range to utilize when grouping events with the timechart command, one can utilize the span argument.

The span argument decides the granularity of the time intervals utilized to group the events. It receives several time units like seconds, hours, minutes, days, months, and weeks. The default span is one hour, although you are free to adjust it depending on your needs.
The argument to state the time range
The argument which can be utilized with the timechart command to state the time range is “span”. The “span” argument defines the size of time buckets which the events will be grouped into. It states the duration of every period like 1 minute, 1 hour, or 1 day. Moreover, the “span” argument is utilized in controlling the granularity of time-based analysis. The reduced the span, the more granular the analysis will be & the bigger the span, the more general the analysis will be.
Syntax of utilizing the “span” argument
The “span” argument can be utilized in the following syntax:
| timechart span=<duration> <function>(<field>) as <alias>The “span” argument needs to be followed by the period of the time buckets, that are specified in the format of number & unit, like “1h” for 1 hour, “5m” for 5 minutes, “1d” for 1 day, etc. The “function” argument states the function to use for the values in every group, like “sum”, “count”, “avg”, “max”, “dc”(distinct count), and “min”. The “field” argument states the field to use the function. The “alias” argument explains the name of the column which will be displayed in a chart.
Let’s find some examples of the way you can utilize the span argument using the timechart command.
Example One: Using the span argument with Min (minutes)
Suppose you have a dataset that contains server logs with a timestamp field. One needs to create a time chart that shows the count of log events every minute. Here is how you can utilize the timechart command together with the span argument:
index=logs sourcetype=serverlogs| timechart span=1m countIn the example above, the timechart command groups all the log events by one minute & calculates the count of events every minute. Its span argument is set to one minute, which means that the time intervals utilized to group the events are one minute long.
Example Two: Utilizing span argument with hours
Suppose you have a dataset that contains sales transactions with a timestamp field. One needs to create a time chart that shows the sum of sales revenue in an hour. Here is how one can utilize the timechart command using the span argument:
index=sales sourcetype=transactions| timechart span=1h sum(revenue)From the example above, the time chart command will group the sales transactions by the hour & calculates the sum of income per hour. The span argument is set to one hour, which means that the time intervals utilized to group the events are one hour long.
Example Three: Utilizing span argument with days
Suppose you have a dataset that contains web traffic logs that have a timestamp field. You need to create a time chart that shows the average number of page views in a day. Here’s how you can utilize the timechart command with a span argument:
index=weblogs sourcetype=accesslog| timechart span=1d avg(pageviews)From the example above, the timechart command will group the web traffic logs by day & calculates the average number of page views in a day. The span argument is set to one day, which means the time intervals utilized to group the events are one day long.
Example Four Utilizing the span argument with weeks
Suppose you have a dataset that contains social media posts that have a timestamp field. You need to create a time chart that shows the count of posts in a week. Here is how you can utilize the timechart command together with the span argument:
index=socialmedia sourcetype=posts| timechart span=1w countFrom the example above, the timechart command groups social media posts by week & calculates the count of posts in a week. The span argument is set to one week, which means the time intervals utilized to group the events are one week long.
Other arguments used together with the timechart command
In addition to the “span” argument, there are other several arguments that can be utilized with the timechart command to modify the time-based analysis. Some of the commonly utilized arguments include:
- “c” argument
This argument is utilized to specify the chart type to utilize. It states the chart type, like “line”, “bar”, “area”, “pie”, or “column”. For instance, “c=bar” will show the chart as a bar chart.
- “limit” argument
This argument is utilized to limit the groups displayed in a chart. It states the maximum number of groups to be shown, beginning with the largest group. For instance, “limit=10” will show the top 10 groups.
- “align” argument
This argument is utilized to align the time buckets to a certain time zone or time value. It stipulates the time value or time zone to align the time buckets. For instance, “align=15m” will align time buckets to 15-minute intervals.
- “useother” argument
This argument is utilized to group small values into an “Other” category. It states the threshold for a minimum value of a group. For instance, “useother=5” will group every value less than five into an “Other” category.
- “before” & “after” arguments
These arguments are utilized to extend the time range before & after the events. They state the duration of the time range to add to the starting and end of the chart. For instance, “before=1d” & “after=1h” will prolong the time range of the chart by one day before the earliest event & one hour after the newest event.
- “overlay” argument
This argument is utilized to overlay numerous functions on the same chart. It states the function to overlay & the field to use the function to. For instance, “overlay=count by field2” will overlay the count of events by the “field2” field on a similar chart.
Conclusion
The span argument is utilized with the timechart command to state the time range to utilize when grouping events in Splunk. It decides the granularity of time intervals utilized to group the events & accepts numerous time units like seconds, minutes, days, hours, weeks, & months. By utilizing the span argument, one could create time series charts that display aggregated information over time & gain insights into patterns and trends.
- Can not Open Config File Opt Splunk Home Openssl CNF?
- In which scenario would a Splunk administrator want to enable a data integrity check when creating an index?
What’s the price of Splunk stock?
Splunk Inc. is a public organization that’s traded on the NASDAQ stock exchange using the ticker symbol SPLK. Let’s have a closer look at Splunk’s stock price, its performance, and other factors that may influence its price in the coming future.

Stock Price Overview
As of February 15, 2023, Splunk’s stock price is at $183.58 per share. The organization has a market capitalization of about $28.75 billion, with an average daily trading volume of about 1.9 million shares.
Performance Over Time
Splunk’s stock cost has had an unstable history, with its peak price of $225.89 in every share back in September 2019 and the lowest price of $105.61 in every share back in March 2020. In recent years, the organization has experienced significant improvement, with a steady rise in revenue & a growing user base.
Factors that influence Splunk’s Stock Price
Numerous factors influence impact Splunk’s stock price. Among them includes;
News & Announcements
News plus announcements linked to Splunk, like product launches, financial reports, and partnerships can influence the stock price. Positive news plus announcements are expected to drive up the stock price, while negative news can lead to a decrease.
Market Trends
Trends in the broader tech market like changes in customer behaviour, technological advancements, and competition, can influence Splunk’s stock price. Positive market trends can result in a rise in Splunk’s stock price, while negative trends can lead to a decline.
Financial Performance
Splunk’s financial performance like its revenue growth, cash flow, and profitability will influence its stock price. Strong monetary performance is expected to drive up the stock price, while weak performance can lead to a decrease in the stock price.
Macroeconomic Factors
Macroeconomic factors like changes in interest rates, geopolitical events, and inflation can impact the stock cost of every company, including Splunk.
Analyst Recommendations
Analyst recommendations like downgrades or upgrades can influence Splunk’s stock price. Positive analyst recommendations are more likely to drive up the stock price, while negative commendations can lead to a decrease.
Conclusion
Splunk’s stock price is influenced by a range of factors that can impact its performance over time. While the organization has experienced a significant increase in recent years, Splunk stock price has been volatile, with the decline in response to a variety of market statuses. Investors should keep on checking the key performance indicators, news plus announcements, & broader market trends to remain informed on the company’s stock price and financial performance.
Setting Retention Period in Splunk
The retention period refers to the amount of time the information is stored in Splunk before it’s deleted. Through setting a retention period, one can control the amount of data kept in your Splunk instance & free up disk space when required. In this blog, we’ll find out how to set the retention period in Splunk & some best practices to assist you to get the most from this feature.
Steps involved when Setting Retention Period
Accessing the Splunk Web interface
To set a retention period in Splunk, you will require to have access to the Splunk Web interface. Just log in to Splunk & click on the “Settings” menu.
Move to the “Indexes” page
From the Settings menu, choose “Indexes” to get access to the Indexes page. This page shows a list of every Splunk index, along with the current settings.
Choose the index you need to modify
From the list of indexes, choose the index you need to modify. This will show the index settings page, where one could change the retention period.
Setting the retention period
To set a retention period, go to the “Retention Period” section & choose the amount of time you need data to be kept in the index. One could select from a range of options which includes a day, a week, a month, and one year.
Save your changes
Once you have set the retention period, select the “Save” button to save changes. The new set retention period will take effect immediately, and information older than the stated time will be deleted.
Best Practices when Setting Retention Period
Consider your use case
Before you set the retention period, it is significant to consider your use case. If you require to keep information for a longer period for regulatory and compliance reasons, you will need to set a longer retention period. If you don’t need to keep information for very long, you can set a shorter retention period to help in freeing up disk space.
Balance retention using disk space
Setting a retention period is a trade-off between data retention & disk space. The lengthier the retention period, the additional disk space you will need. Always ensure you have sufficient disk space to hold the data you need to keep.
Monitor disk usage
It’s significant to monitor disk usage frequently to make sure you’ve enough disk space. If your disk usage is approaching capacity, you will require to add additional disk space or adjust the retention period to your Splunk instance.
Use numerous indexes
If you’ve distinct data sources with different retention requirements, it is a good idea to form separate indexes for every source. This will enable you to set various retention periods for every source and better management of the disk space.
Archiving old data
Consider archiving old information to a different location like cloud storage or a secondary storage device to preserve your disk space and enhance performance.
Automating data deletion
Automating the process of deleting old information to guarantee that your retention policy is applied consistently. You can utilize Splunk’s data management features or a script to automate the process.
Conclusion
The retention period is the main setting in Splunk which determines how long information is kept in your instance. By setting the retention period, one could control how much information is stored & free up disk space when needed. To get the most from this feature, it’s significant to consider your use case, monitor disk usage, use numerous indexes if require, and balance retention with disk space.
“OR” Condition in Splunk Search
Splunk is a dominant log analysis tool that enables one to search, monitor, & analyze huge amounts of information generated by different sources. Among the most common operations in Splunk search is combining several search terms utilizing an “OR” condition. The OR condition returns events that match at least one search term.
From this article, let’s explore how to utilize the OR condition in Splunk searches and check out some tips & tricks for getting the most from this powerful feature.
Syntax
The basic syntax for OR condition in Splunk is easy. All you need to do is to separate your search terms using the “OR” keyword. Here is an example:
error OR warning
This search returns all events which contain either the word “warning” or the word “error”.
You can also utilize parentheses to group search terms & control the order of evaluation. For instance:
(error OR warning) AND source=myapp
The results from this search will be all events that contain either a “warning” or “error” and are from the source “myapp”.
Tips & Tricks
Use quotes for exact matches
If one needs to search for a particular phrase, you will utilize quotes around the phrase. For instance:
“error occurred” OR “warning message”
The outcomes of this search will return every event which contains the phrase “error occurred” or the phrase “warning message”.
Use NOT operator
The NOT operator enables one to exclude events that match a certain search term. For instance:
error OR warning NOT source=myapp
The results of this search will return every event which contains either a “warning” or “error” but exclude all events from the source “myapp”.
Use wildcard characters
Wildcard characters will enable you to search for several variations of a phrase or word. For example:
error* OR warn*The results of this search will return every event which contains words that starts with “error” or “warn”.
Use field extraction
Field extraction enables one to extract certain values from your events & utilize them in your searches. For instance, you may have an event with a message field that consist of the following:
message="error occurred in module XYZ"One can extract the “module” value utilizing the following search:
error OR warning | rex field=message ".* in module (?<module>.*)"This search command will extract the “module” value from the message field & return every event which contains either a “warning” or “error”.
Conclusion
The OR condition is a great feature in Splunk that enables one to mix several search terms & return events that match at least one of the terms. Through utilizing quotes, wildcard characters, the NOT operator, & field extraction, you will be able to refine your searches & get even more exact results.
How to work for Splunk?
Splunk is the greatest brand in offering data analytics plus visualization tools, and it’s widely regarded as the best place to work. This brand is known for its advanced products, its passionate and talented employees plus its supportive plus inclusive culture. In this blog article, let’s have a look at what it’s like to be a Splunk employee and what you can expect if you’re considering a career with the organization.
Company Culture
Among the things which set Splunk apart is its culture. The organization is known for being inclusive and supportive, and for fostering a work environment where staffs feel valued plus empowered. Splunk places a strong importance on teamwork, open communication, and collaboration, & encourages the staff to take ownership of their work & to be creative plus innovative.
Work Environment
The work environment at Splunk is dynamic and fast-paced, with a concentration on continuous growth and innovation. The organization is made up of a talented plus passionate team of employees dedicated to offering the best possible products plus services to their customers.
At Splunk, you’ll have the chance to work on meaningful and challenging projects, cooperate with colleagues from all over the world, and make a real influence in the world of data analytics & visualization. The company is understood for its supportive plus inclusive work environment, and the employees are encouraged to be innovative and creative and to bring new ideas & perspectives to the table.
Career Opportunities
Splunk has a wide range of job opportunities, from junior positions to senior leadership roles. The organization is committed to assisting employees to grow plus develop their careers and offers a variety of training plus development programs to support this objective.
Among the roles which are available at Splunk include software engineering, sales, product management, marketing, & customer support. Furthermore, the company also features a strong culture of promoting from within, so if you’re looking to improve your career, there are several opportunities to do so at Splunk.
How you can apply for a Job at Splunk
If you’re interested to work at Splunk, the initial step is to visit the company’s website and careers page and look for available job openings. The site is regularly updated with new job listings, and one can filter the search results by role, location, and other criteria to get the job that’s right for you.
When you’ve found a job that you’re interested in, you can send your application via the company’s online application system. This involves submitting your cover letter, and resume, and completing a series of evaluations and interviews.
It’s significant to note that the Splunk hiring process can be competitive, so it’s significant to prepare well & to present yourself in the best possible light. Furthermore, you should also be certain to research the company & its products and be ready to answer questions about why you’re interested to work for Splunk.
Steps to take to increase your probability of getting a job with Splunk company
Step 1: Research the Company
Before you make an application for any job with Splunk, it’s significant to research the company & understand what it does & the kind of culture it has. Moreover, you can begin by visiting Splunk’s official website and reading about the organization’s products & services. You can also check for articles and news stories on Splunk to know more about the company and the way it works.
Step 2: Review Job Openings
The moment you have a better understanding of Splunk and what the organization does, you can review the recent job openings to check if there is an opening that aligns with your experience and skills. You can go to Splunk’s careers page to check the current job position and learn more about each position.
Step 3: Create a Strong Cover Letter and Resume
Your cover letter and resume are your opportunities to make a better first impression on possible employers, so it is significant to take the time to create the best application package. Your resume should point out your relevant experience & skills. Moreover, your cover letter should clarify the reason why you’re a suitable fit for the position you’re applying for.
Step 4: Prepare for the Interview
If your application is chosen, you’ll be invited to an interview. From this point, you have a chance to meet with the hiring manager. You will also learn more about the position & the company. It is significant to get ready for the interview by researching the organization and the position, practicing your replies to common interview questions, & dressing professionally.
Step 5: Follow Up After the Interview
After having an interview, it is a good idea to follow up with the hiring manager to thank them for the chance to meet them & to express your constant interest in the opportunity. This shows that you’re proactive and that you’re committed to pursuing a job with Splunk.
Conclusion
Working for Splunk is a rewarding and exciting experience, offering employees the chance to work on innovative plus impactful projects. They will also work together with talented colleagues to make an actual difference in the world of data visualization and analytics. If you’re interested in a career with Splunk, you should visit the company’s careers official site and search for job openings. With its supportive plus inclusive culture, and its pledge to helping employees grow & develop their careers. Moreover, Splunk is a great place to work & build a rewarding plus successful career.
How Old Is Splunk?
Splunk company has become among the leading providers of data analytics plus visualization tools, with several customers across several industries. In this blog, we will have a look at Splunk’s history and the way it has evolved in the past years.
Founding & Early Years
The splunk brand was founded back in 2003 by Rob Das, Michael Baum, & Erik Swan. The organization was originally started to assist companies to collect, storing, & analyze machine-generated data, which was getting to be an important source of details for businesses.
In previous years the company, Splunk concentrated on developing its main product, which was designed to assist organizations to make sense of the huge amounts of machine data that they were generating. The brand quickly gained traction in the market & started to attract an increasing number of customers, including some of the largest companies around the world.
Growth & Expansion
Over the years, Splunk kept on growing and expanding both in terms of its product offerings and its customer base. The brand introduced new products plus features which helped customers to collect, analyze, plus visualize their data in a modern plus innovative way.
Among the key milestones in Splunk’s history was its initial public offering (IPO) back in 2012. The organization’s IPO was broadly regarded as a success, plus the stock price quickly rose, assisting to establish Splunk as the leading brand in the market.
Continued Evolution
After its IPO, Splunk has kept on evolving plus growing. The organization has attained several smaller brands and has introduced new features and products which have assisted in further improving its offerings.
Among the key trends in the market, over a few years has been the development of cloud computing. Splunk has reacted to this trend by investing in cloud tech and by developing new services and products which assist customers to leverage the advantages of cloud computing.
Another trend in the market has been the increasing importance of machine learning and artificial intelligence (AI). Splunk has reacted to this trend by investing in these techs and by developing new services and products which assist customers to leverage the power of machine learning and AI.
Recent Developments
Moreover, Splunk has continued to grow and evolve in recent years. The company focuses on expanding its offerings plus assisting customers to better manage plus analyze their data. Among the key developments in the organization over the last few years are the acquisition of VictorOps, a provider of collaboration solutions and incident management, and the introduction of new features and products like the Splunk Data Stream Processor & the Splunk Machine Learning Toolkit.
Conclusion
Splunk is an organization with a rich history of growth and innovation. Over the years, the organization has evolved plus expanded, responding to varying market trends plus customer needs. Today, Splunk is among the leading providers of data analytics & visualization tools, with a wide range of users across many industries.
Splunk’s Biggest Competitor
Splunk is the best provider of operational intelligence software which assist organizations to collect, visualizing, and analyzing machine-generated information from different sources. The organization has been increasing rapidly over the years plus it has become a top player in the market for log management plus big data analytics. However, like every other organization in the market, Splunk also faces higher competition from other players available in the market. Let’s have a look at Splunk’s biggest competitor.
Elastic
This is among the biggest competitors of Splunk in the market. Elastic is an organization that offers open-source software for search and log analysis. Elastic’s flagship product (the Elastic Stack) is a set of tools that assists organizations in collecting, storing, and analyzing log data. Moreover, the Elastic Stack is the best alternative to Splunk & offers several similar features like real-time search, visualization, and indexing.
Among the main benefit of Elastic compared to Splunk is its open-source nature. Elastic’s software is free to utilize and can be easily improved to meet the particular needs of a company. This makes it a popular choice for companies that need a cost-effective solution for search and log analysis.
Scalability is another benefit of Elastic over Splunk. Elastic’s software is made to scale horizontally meaning that organizations can add several servers to handle growing amounts of information. This makes it a nice-looking option for companies that need to process huge amounts of information in real time.
LogRhythm
Another great Splunk competitor is LogRhythm and it’s a leading provider of SIEM (security information and event management) solutions. This company’s platform is made to assist companies to collect, visualize, plus analyze machine data generated by applications and security devices. LogRhythm’s concentrates on security have made it a prevalent choice among companies looking to increase their security posture & protect against cyber threats.
Among the key differentiators of LogRhythm is its concentration on security. The organization’s platform is made precisely for security data, which sets it apart from other information analytics tools that may not have a similar level of security-focused features.
Another main differentiator of LogRhythm is its real-time threat detection abilities. The platform utilizes machine learning & artificial intelligence to find and alert on possible security threats in real-time, assisting organizations to rapidly respond to threats & minimize damage.
Sumo Logic
Sumo Logic is another big rival of Splunk in the market. The company is a cloud-based log analysis & management solution which assists organizations to collect, analyze, plus visualize machine-generated information from different sources. The organization’s software is designed to offer real-time insights into log data & assist organizations in rapidly identifying & resolve issues.
Among the main benefits of Sumo Logic over Splunk is its cloud-based nature. This company’s software is hosted in the cloud making it simpler for organizations to access plus manage their log data. This also excludes the need for companies to invest in hardware plus infrastructure to operate the software.
Another benefit of Sumo Logic compared to Splunk is its simplicity. Its software is made to be user-friendly and simple to use making it a popular choice for companies that are looking for a simple solution for management and log analysis.
VMware vRealize Log Insight
VMware vRealize Log Insight is also among the biggest competitor to Splunk and is best in offering log management & analysis solutions. The company’s platform is made to assist organizations to collect, analyze, plus visualize machine-generated information from several sources, including virtualized environments.
Among the main differentiators of vRealize Log Insight is its incorporation with VMware’s virtualization & cloud infrastructure solutions. Moreover, the platform is made to operate seamlessly with VMware’s products. This has made it the best choice among companies using VMware’s tech stack.
Another main differentiator of vRealize Log Insight is its concentration on virtualized environments. The platform is specially designed to handle the distinct challenges of virtualized environments, like the need to analyze information from several sources and the dynamic nature of virtualized surroundings.
Graylog
Another big competitor of Splunk in the market is Graylog. This is an open-source log analysis plus management solution which assists organizations to collect, analyze, and storing log data. The company’s software is made to offer real-time insights into log information and assists organizations in easily identifying plus resolving issues.
Among the main benefit of Graylog over Splunk is its open-source nature. It’s free to use Graylog’s software and can be easily improved to meet the exact needs of a company. This has made it a common choice for companies that are looking for a cost-effective solution for management and log analysis.
Another benefit of Graylog over Splunk is its scalability. The company’s software is made to scale horizontally, which means that the company can add more servers to accommodate the increasing amounts of data. This makes it a good option for companies that require to process huge amounts of information in real-time.
Conclusion
The Splunk company faces competition from several service providers in the market, including LogRhythm, Elastic, VMware vRealize Log Insight, etc. Each of the competitors offers distinct features plus capabilities that set them apart from Splunk. The features include open-source models, security-focused features, scalability, integration with virtualization & cloud infrastructure solutions, and real-time threat detection. When assessing these competitors, it’s significant to consider your particular needs and your organization’s requirements.
How To Detect DOS Attacks Using Splunk?
A DoS (Denial of Service) attack is a kind of cyber-attack that aims in making a website, application, or network resource inaccessible to its users. This is achieved by overwhelming the target with traffic making the server crash or unresponsive. In this blog, we will discuss how you will detect a DoS attack utilizing Splunk, a software platform for analyzing, searching, & visualizing machine-generated data.
Step 1: Collect Network Logs
To detect a DoS attack utilizing Splunk, the initial step is to collect network logs from your systems & applications. This can involve the use of firewall logs, application logs, and web server logs. These logs should consist of details about incoming plus outgoing network traffic, including ports, timestamps, and IP addresses.
Step 2: Load Logs into Splunk
Once you’ve collected the network logs, the following step is loading them into Splunk. Splunk offers various methods for loading information like uploading files, utilizing the Splunk forwarder, and utilizing APIs. Once the logs are loaded to Splunk, you can begin using Splunk’s powerful search plus analysis capabilities to discover a DoS attack.
Step 3: Index the Log Data
Once you’ve collected the log data, you require to index it in Splunk. Indexing the information allows Splunk to analyze, search, & visualize the data, making it simpler to identify anomalies and patterns. To index the log data, one could utilize the Splunk Web interface or Splunk command line interface.
Step 4: Create a Dashboard
After indexing the log data in Splunk, one can create a dashboard to check network traffic & find possible DoS attacks. The dashboard needs to include graphs plus charts which show network traffic over time, including the number of bytes and packets, the source IP addresses, plus the destination IP addresses.
Step 5: Use Splunk to Get Abnormal Traffic Patterns
Among the key signs of a DoS attack is an unexpected increase in incoming traffic. To sense this, you can utilize Splunk’s search plus analysis capabilities to find abnormal traffic patterns. For instance, you can utilize a search query to check for incoming traffic from a single IP address that’s significantly higher compared to the average traffic from the IP.
Step 6: Use Splunk to check Network Resources
Another method of detecting a DoS attack utilizing Splunk is to check the resources on your network, like CPU usage & memory utilization. During a DoS attack, the resources will be heavily taxed, making the system crash or slow down. To monitor the resources, you can utilize Splunk’s performance monitoring features like the Performance Analyzer and Metrics Workspace.
Step 7: Use Splunk Alerts to Warn You of a DoS Attack
To be informed of possible DoS attacks, you should set up alerts in Splunk. Alerts are activated when there are conditions are met, like the significant rise in network traffic from one IP address. To be warned of a DoS attack in real time, one could utilize Splunk’s alerting feature. Splunk alerts enable one to set up conditions that, when met, will activate an alert to be sent via SMS, email, or other notification methods. For instance, one can set up a warning to be triggered when incoming traffic from one IP address surpasses a certain threshold.
Step 8: Monitor the Dashboard & Alerts
Once the dashboard and alerts are set up, you should monitor them regularly to detect potential DoS attacks. If you receive an alert, you can use the dashboard to investigate the issue further and determine the cause of the increase in network traffic.
Step 9: Respond to the DoS Attack
Once you’ve detected a DoS attack utilizing Splunk, the last step is how to respond to this attack. This can include blocking the IP addresses which are causing the attack or raising the capacity of your network resources to endure the increased traffic. The particular response will rely on the nature of the attack plus the resources available to you.
Conclusion
A DoS (Denial of Service) attack can have a substantial impact on the accessibility of your website, network, or application resources. By utilizing Splunk to gather network logs, find abnormal traffic patterns, set up alerts, and monitor network resources you can easily detect a DoS attack & take the required action to reduce its impact. Splunk’s powerful search & analysis capabilities make it an efficient tool for sensing and reacting to DoS attacks.
How Do I Create A Lookup Table In Splunk?
In Splunk, lookup tables are a method of enriching your data by adding extra details from external sources. These details can be utilized to improve the outcome of your searches, offer context for events, or for improving data for visualization functions. Let’s look at the steps involved when you are creating a lookup table in Splunk.
Step 1: Prepare Your Data
Before you begin to create a lookup table, one requires to prepare the information which will be utilized in the table. This information needs to be in a Splunk readable format like a CSV file and should contain all of the details you need to include in a table.
It’s the best idea to clean & standardize your information before importing it to Splunk. This can assist in ensuring that the details in the lookup table are consistent plus accurate.
Step 2: Create a Lookup Table
To start creating a lookup table in Splunk, you require to access the Lookup Definition interface. You will achieve this with the help of the steps below:
- Log into the Splunk interface
- Click on the “Settings” menu
- Move to “Lookups”
- Click on “Lookup definitions”
- Open “New”
- Once you’re on the Lookup Definition page, you will create a new lookup table by stating a table’s name, the variety of data that will be kept in the table, and the data location.
Step 3: Import Data into Lookup Table
After creating a lookup table, you require to import your information into the table. To achieve this, you can utilize the steps below:
- Click on the lookup table you created
- Select “Edit”
- Click on “Import”
- Select the data file you need to import
- Open “Upload”
- After uploading the data, you can preview the information in the lookup table to ensure it was imported properly.
Step 4: Utilize the Lookup Table in Search
Now that you’ve created a lookup table and imported information into it, you can utilize the lookup table in a search. To achieve this, follow the steps highlighted below.
- Run a search that includes the data you need to enrich
- Click on the “Add-ons” menu
- Open “Lookups”
- Select the lookup table you need to use
- Specify the way you need to utilize the lookup table. For instance, add extra details to your search outcomes.
- Run the search
- The outcomes of the search will now consist of details from the lookup table.
Step 5: Update your Lookup Table
Over time, the data in the lookup table may be inaccurate or outdated. To keep the data in the lookup table up-to-date, you’ll require to update the table as required.
To update you need to follow the same steps utilized in importing data into the table, with one extra step to overwrite the current data.
Conclusion
Lookup tables are a great tool in Splunk that can assist you to enrich your information and improve the outcomes of your searches. Following the above steps outlined in the article, you will be able to create a lookup table, import data into the table, & utilize the lookup table in a search. Furthermore, by updating the lookup table as required, you can be sure that the details in the table remain up-to-date and accurate.